This post may contain Amazon affiliate links which means, as an Amazon Associate, I may receive a small commission from purchases made through these links at no cost to you. I only recommend products I have personally used. To learn more, please see my privacy policy page.
Maps are representations of our world, crafted through a combination of key elements such as titles, cartographer credits, data sources, scales, projections, and orientation tools. These components ensure maps are accurate, informative, and relevant for navigation, analysis, and understanding spatial relationships.
Key Words
- Cartography
- Data Source
- Geographic Information System (GIS)
- Map Evolution
- Navigation
- Orientation Tools
- Projection
- Scale
- Spatial Analysis
- Spatial Relationships
Join me as we explore each map component and their contribution to the map’s utility and integrity. Learn how the evolution from traditional to digital maps has expanded their capabilities, making them indispensable tools in our daily lives and professional fields. Read on…
Key Takeaways
- Comprehensive Components Enhance Map Utility: The integration of critical elements such as the map’s title, cartographer’s name, data sources, and key cartographic elements like scale, projection, and orientation tools are essential in making maps valuable tools for exploration, analysis, and decision-making, ensuring accuracy, reliability, and relevance.
- Evolution from Traditional to Digital: The transition from traditional hand-drawn maps to sophisticated digital maps and GIS platforms has significantly expanded the capabilities of maps, enabling real-time data analysis, interactive exploration, and the integration of complex spatial datasets.
- Transformative Power of Maps: Maps hold a transformative power in visualizing and understanding spatial relationships, serving not just as tools for navigation but as dynamic platforms for comprehending geographical phenomena, influencing decision-making processes, and facilitating a deeper engagement with our environment.
Maps: An Introduction
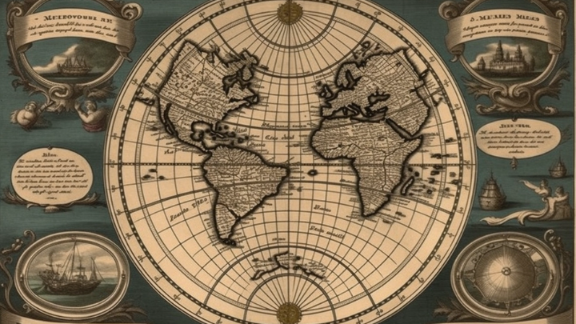
Maps are indispensable tools in geography and GIScience, acting as essential mediums for visualizing, analyzing, and communicating spatial information. At their core, maps are representations of space, designed to convey the spatial relationships between different elements of the physical and human world. They allow geographers, scientists, and the general public to explore, understand, and interact with the complexities of our environment in a simplified and accessible format.
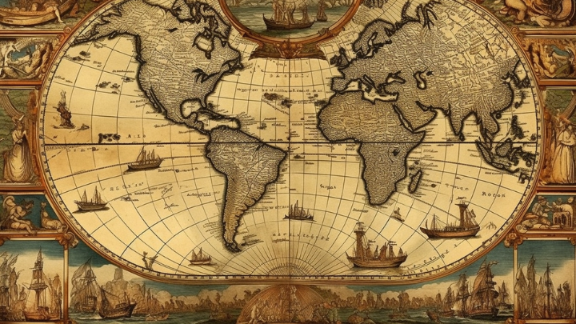
The evolution of maps reflects the advances in technology and our growing understanding of the world. Traditional maps, once painstakingly drawn by hand on paper, served as the primary means for navigation and exploration for centuries. The advent of digital technology has transformed cartography, ushering in an era of digital maps and Geographic Information Systems (GIS). These modern tools offer dynamic, interactive capabilities that far exceed the static nature of their predecessors, enabling real-time data analysis, sophisticated spatial modeling, and the integration of vast amounts of information from various sources.
This transition from traditional to digital maps marks a significant milestone in the field of geography and GIScience, expanding the possibilities for research, education, and decision-making. Digital maps have become ubiquitous in our daily lives, powering everything from web-based navigation services to complex environmental monitoring systems, demonstrating the enduring importance and relevance of maps in a rapidly changing world.
Maps: What's in a Name?
Titles on maps play a crucial role as they provide the viewer with immediate context about the map’s content and purpose. A well-chosen title communicates the theme or the specific geographic area being represented, helping users to quickly understand what the map is about and what kind of information it conveys. This is particularly important in educational settings, publications, and professional reports where maps are used to support data visualization and spatial analysis.
Including the word “map” in the title is often considered redundant because the presentation format already indicates that the document is a map. Instead, the title should focus on conveying more specific information, such as the geographic area covered (e.g., “The Amazon Rainforest”) and the theme or the specific aspect being illustrated (e.g., “Annual Rainfall Distribution”). This approach ensures the title is informative and efficiently uses the limited space to enhance the map’s communicative value. By avoiding redundancy, the title can more effectively guide the viewer’s understanding and expectations, making the map more accessible and its message clearer.
Maps: Signature Styles
Including the name of the cartographer, creator, or production agency on a map is vital for several reasons. First, it provides credit to the individuals or organizations responsible for the map’s creation, acknowledging their effort, expertise, and intellectual property. This is particularly important in academic, professional, and commercial contexts where attribution is a fundamental aspect of ethical practice and copyright.
Second, the creator’s name can also serve as a marker of the map’s reliability and accuracy. A map produced by a reputable cartographer or organization is likely to be trusted more than one without a clear source. It allows users to assess the credibility of the map based on the reputation of the creator or agency, which is crucial when maps are used for decision-making, education, or research.
Including this information facilitates further inquiry or feedback. If users have questions, need clarification, or wish to access more detailed data or related maps, knowing the creator or agency enables them to reach out directly.
Finally, the inclusion of the creator’s name can also aid in historical or archival research. Maps are valuable documents that can reflect the geographical knowledge, cultural perspectives, and technological capabilities of their time. Identifying the cartographer or production agency helps historians and researchers trace the evolution of mapping techniques, understand the context in which the map was produced, and assess its historical significance.
Timeliness and Truths: Map Data
The source and date of the data on a map refer to the origin of the geographical information used to create the map and the time at which that data was collected or compiled. This information is crucial for several reasons:
Reliability and Accuracy: Indicating the source of the data helps users assess its reliability. Data from authoritative and reputable sources, such as government agencies, research institutions, or established mapping organizations, are generally considered more accurate and trustworthy. The date of the data is equally important because it indicates how current the information is. This is vital in fields like environmental studies, urban planning, and disaster management, where using outdated information can lead to incorrect conclusions or ineffective decisions.
Relevance: The relevance of a map to a user’s needs can greatly depend on the timeliness of its data. For instance, a map showing demographic statistics from a decade ago may not be useful for planning current public services or infrastructure projects. Including the date of the data ensures that users can determine the map’s applicability to their current situation.
Comparative Analysis: When using multiple maps for comparative studies or temporal analysis, knowing the data’s source and date is essential. This information allows researchers and professionals to compare changes over time, identify trends, and make predictions with greater confidence.
Transparency and Reproducibility: Including this information enhances the transparency of the map-making process and facilitates the reproducibility of research findings. Other researchers or cartographers can refer to the same data sources for verification or further study, promoting scientific integrity and collaboration.
Overall, the inclusion of data source and date enriches the map’s informational value, enabling users to make informed decisions, conduct accurate analyses, and trust in the map’s representations.
Maps: A Moment in Time
Including the date the map was created is crucial for several reasons, enhancing its utility, relevance, and historical value. Here’s why:
Temporal Context: The creation date provides essential temporal context, indicating when the map was made. This is particularly important because geographical features, political boundaries, and demographic information can change over time. Knowing the map’s creation date helps users understand the specific moment in time the map represents.
Relevance and Accuracy: For users seeking current information, the map’s creation date signals its relevance and potential accuracy. A map that’s current for one case might be considered outdated for another, depending on the nature of the data and its application. For instance, a map used for navigating city streets needs to be more current than one used for studying historical urban development patterns.
Comparative Analysis: When comparing maps to track changes in geographical or human-made features over time, the creation date of each map is vital. It allows researchers, planners, and the public to analyze development, environmental changes, or shifts in political boundaries accurately.
Credibility: A map that includes its creation date demonstrates transparency, contributing to its credibility. Users are more likely to trust and rely on a map when they can assess its timeliness and relevance to their needs.
Archival Value: From a historical perspective, the creation date adds archival value to the map. It helps historians, geographers, and other researchers place the map in its correct historical context, aiding in the study of geographical knowledge and cartographic techniques of specific periods.
Overall, the inclusion of the creation date is a fundamental aspect of map design that ensures the map is useful, reliable, and appropriately contextualized for its intended audience and purpose.
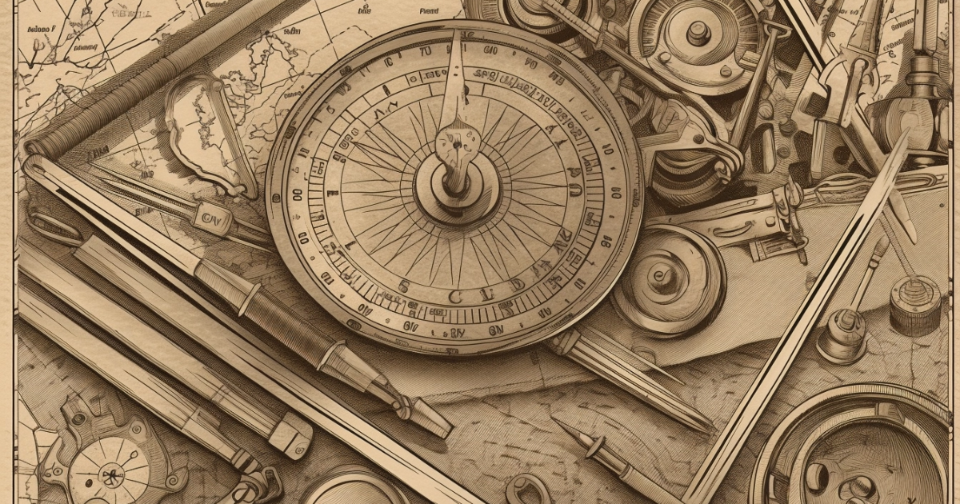
Cartographic Trinity: Scale, Projection, and Orientation in Maps
Navigating the world through maps requires more than just a keen eye; it necessitates an understanding of the key cartographic elements that make up these fascinating tools of geography and GIScience. These elements—scale, projection, and orientation tools like the north arrow and graticule—are the backbone of map design, ensuring that maps are not only informative but also accurate and reliable.
Scale provides a quantifiable link between the map and the real world, allowing us to measure distances and understand the extent of the area depicted. Projection tackles the complex challenge of representing the Earth’s curved surface on a flat map, a process that involves trade-offs in terms of accuracy and distortion.
Meanwhile, orientation tools such as the north arrow and graticule lines give us geographical context and assist in navigation. Together, these elements form the foundation of cartographic science, enabling maps to function as powerful tools for exploration, analysis, and communication in our quest to understand the spatial dimensions of our world.
Map Scale
Scale on a map refers to the relationship between a distance on the map and the corresponding distance on the ground, indicating how much the real world has been reduced to fit on the map. It’s a critical concept in geography and GIScience, enabling users to understand the extent of the area represented and to measure distances accurately. There are three main types of scale representations on maps:
Ratio or Fractional Scale: This presents the scale as a simple ratio or fraction (e.g., 1:100,000), indicating that one unit of measurement on the map represents 100,000 of the same units on the ground. It’s a universally understood method that can be applied regardless of the measurement system used.
Graphic Scale: Also known as a bar scale, it’s a visual representation of scale that consists of a line or bar divided into sections that are labeled with corresponding ground distances. This scale adjusts correctly with map size changes, making it particularly useful for maps that might be resized.
Verbal Scale: This describes the scale in words (e.g., “One-inch equals one mile”). It’s straightforward but becomes less useful if the map is reproduced at a different size, as the verbal description does not adjust like a graphic scale.
Understanding map scale is fundamental for accurate interpretation and usage of maps, as it directly affects how we perceive spatial relationships and distances.
Map Projection
In the context of maps, “projection” refers to the method used to represent the curved surface of the Earth on a flat map. This process is crucial because the Earth is a three-dimensional object, and accurately depicting its surface on a two-dimensional plane involves complex transformations. Projections are important for several reasons:
Accuracy: Different projections are designed to preserve certain attributes such as area, shape, distance, or direction, but no single projection can preserve all these aspects simultaneously. Choosing an appropriate projection is essential for maintaining the accuracy of the represented geographical information in the context of the map’s purpose.
Purpose: The choice of projection can significantly impact the map’s effectiveness in communicating spatial information. For instance, a Mercator projection is well-suited for navigation because it preserves angles and directions, while an equal-area projection is better for thematic maps that display spatial distributions or patterns.
Distortion: All map projections introduce some form of distortion because they flatten the Earth’s curved surface. Understanding the nature and extent of this distortion is vital for interpreting the map correctly, especially when making precise measurements or comparisons.
Visualization: Projections influence how we visualize and understand the world. They can shape our perceptions of geography and geopolitics, emphasizing or diminishing the size and importance of certain regions.
Selecting the right projection is a fundamental aspect of map design, directly affecting the map’s utility, accuracy, and the way spatial information is interpreted. It’s a critical decision in GIScience and cartography that ensures the map serves its intended purpose effectively.
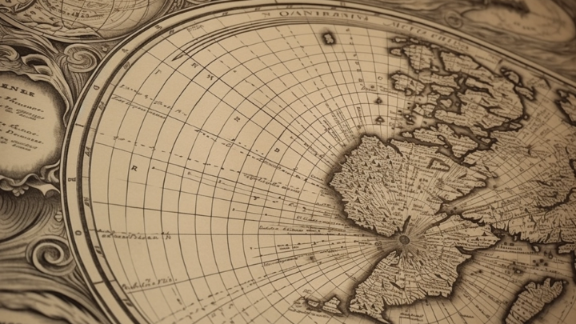
Map Orientation
A north arrow on a map is a symbol that indicates the direction of north relative to the map’s layout, providing the viewer with orientation. It’s essential for understanding the map’s alignment with the Earth’s geography, especially when navigating or interpreting spatial relationships.
A graticule, on the other hand, is a network of lines representing the Earth’s latitude and longitude system on the map. It helps in precisely locating positions on the Earth’s surface by providing a global reference system. The graticule lines are usually drawn at regular intervals and enable users to understand the geographic extent covered by the map, as well as to measure distances and angles directly on the map’s surface. Both the north arrow and graticule are crucial for accurately conveying spatial information and aiding in the map’s interpretation and navigation.
Wrap Up...
In conclusion, each component of a map, from its title to the cartographer’s attribution, the source and date of data, to the essential cartographic elements like scale, projection, and orientation tools, plays a pivotal role in crafting a map that is not only accurate and informative but also a valuable tool for exploration, analysis, and decision-making. These elements collectively ensure that a map can effectively communicate spatial information, guiding users through complex geographical terrains and facilitating a deeper understanding of spatial relationships.
Reflecting on the transformative power of maps, it’s clear that they are much more than mere representations of physical and human landscapes. They are dynamic instruments that have evolved from simple navigational aids to sophisticated digital platforms capable of integrating and analyzing vast datasets. This evolution underscores the enduring significance of maps in our quest to visualize and comprehend the world around us. In the hands of skilled cartographers and informed users, maps become powerful lenses through which we can interpret the past, navigate the present, and plan for the future, highlighting the indispensable role they play in our interaction with the spatial dimensions of our planet.